Senior Graphic Designer Salary in Montebello, CA: $106,547 (2026)
Quick Answer:The top tier of graphic designers working in Montebello, CA — those at or above the 90th percentile — pull in $106,547/year or more for 2026, based on BLS OEWS 2025 estimates for SOC 27-1024. Strip back Montebello's price premium (BEA RPP 113.1, 13% above national) and that top-decile pay carries the same buying power as $94,206 in average-cost America. The 55% spread above city median typically rewards 7+ years of practice or specialty credentials.
Based on BLS state-level estimates · View source
In Montebello, California, experienced graphic designers can expect to see substantial rewards as they advance in their careers. With a median annual salary projected at $68,740 in 2026, seasoned professionals who excel in their roles can reach top-tier pay, with the 90th percentile earning up to $106,547. This competitive compensation significantly surpasses the national average for senior graphic designers, which stands at $65,075, highlighting the city's attractive market for high-caliber talent. The disparity between the median salary and the upper echelon of earnings demonstrates the premium placed on expertise and innovation. Transitioning to the upper pay brackets often requires mastering specialized skills or leadership roles, making it essential for designers to continuously expand their capabilities to meet evolving industry demands.
About the Montebello Market
Salary estimated from California average ($78,000) adjusted for local cost of living.
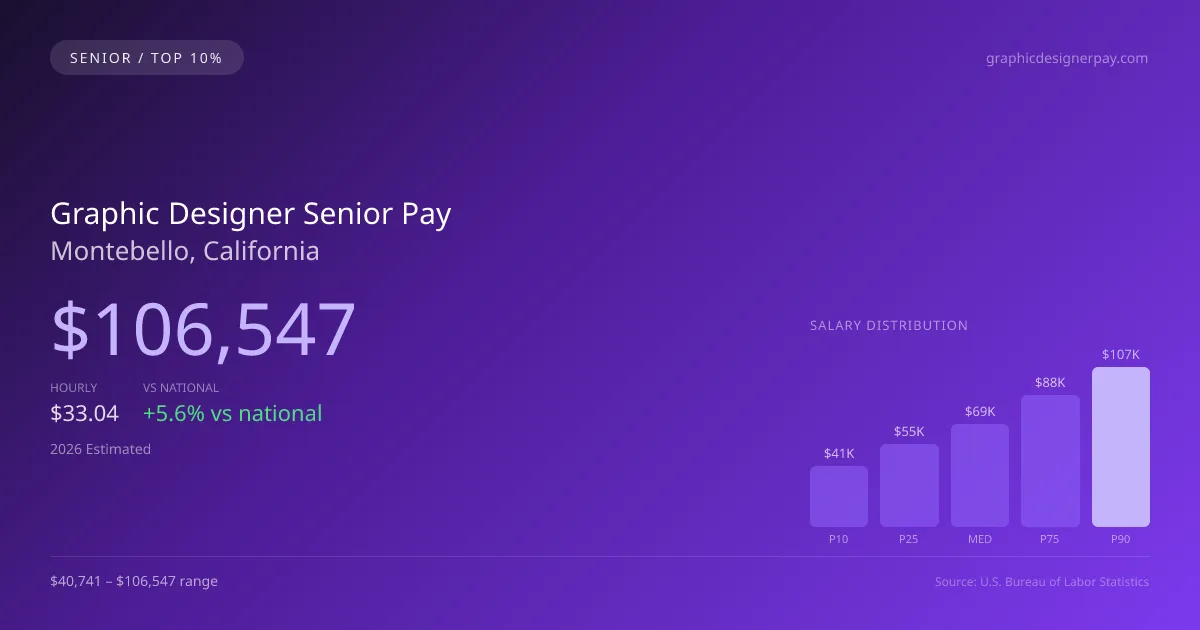
2026 Salary Percentile Distribution in Montebello
Experienced graphic designers at the top of the pay scale in Montebello earn between $87,986 and $106,547 per year (2026 est.). This $65,806 range from 10th to 90th percentile reflects significant earnings potential growth over a career. The Montebello median of $68,740 sits 5.63% above the US median.
Top Salary Comparison
| Level | Montebello | National |
|---|---|---|
| Median (P50) | $68,740 | $65,075 |
| 75th Percentile | $87,986 | $84,579 |
| 90th Percentile (Top 10%) | $106,547 | $108,435 |
In Montebello, experienced graphic designers (P90) earn 55.00% more than the local median — reflecting the significant value of specialization and tenure in this market.
What Drives Top Graphic Designer Pay in Montebello
Advanced Certifications in California
CA graphic designers with additional specialty certifications within the graphic design field earn significantly above the $68,740 median. Expanded-scope credentials are increasingly valued by Montebello employers.
Specialty Focus
Graphic Designers focusing on high-acuity or specialty areas within the graphic design field in Montebello command premium compensation, often reaching the $87,986–$106,547 range.
Large Health-System & Multi-Site Experience
Large hospital systems and multi-site employers in the Montebello metro area often pay above-market rates for experienced graphic designers who demonstrate efficiency and leadership.
Employer Loyalty & Patient Relationships
Long-tenured graphic designers in Montebello with established relationships have strong negotiating leverage. In this developing market, retention bonuses and annual raises are common for top performers.
Continuing Education & Leadership
Graphic Designers in California who pursue advanced degrees, mentor junior staff, or lead clinical education programs position themselves for the highest compensation tiers and management roles.
Graphic Designer Career & Wage Growth Path in Montebello
Clinical Graphic Designer
0-5 yearsSenior/Lead Graphic Designer
5-10 yearsGraphic Designer Department Manager
10+ yearsEducator / Specialty Leadership
AdvancedMontebello ranks #109 of 158 California cities for top earner graphic designer salary (90th percentile: $106,547).
Top 10% graphic designer compensation in Montebello ($106,547) is 16.97% below the California average P90 ($128,327).
2019 BLS Actual
$87,656
2025 BLS Actual
$103,083
2026 Current Est.
$106,547
2019–2027 Growth
+25.6%
Salary Trajectory for Graphic Designers in Montebello (2019–2027)
2019–2025: actual BLS OEWS data for this metro area. 2026+: CAGR 3.36% projection.
| Year | Annual Salary | Status |
|---|---|---|
| 2019 | $87,656 | Actual |
| 2020 | $91,813 | Actual |
| 2021 | $96,549 | Actual |
| 2022 | $99,162 | Actual |
| 2023 | $98,701 | Actual |
| 2024 | $135,484 | Actual |
| 2025 | $103,083 | Actual |
| 2026(current) | $106,547 | Estimated |
| 2027 | $110,127 | Projected |
Top-earning graphic designers (90th percentile) in Montebello saw their compensation grow 17.6% from $87,656 in 2019 to $103,083 in 2025, based on 7 years of BLS OEWS data for this metropolitan area. At a 3.36% annual growth rate, senior-level pay is projected to reach $110,127 by 2027, reflecting continued demand for clinical expertise and expanded-function credentials.
Note: Historical values (2019–2025) are actual BLS OEWS figures for the Montebello metropolitan area, sourced from annual Occupational Employment and Wage Statistics surveys. 2026–2026 figures are current estimates, and 2027 values are projections, calculated using a 3.36% CAGR derived from 7-year BLS historical data. Actual salaries may vary based on employer, experience, certifications, and local market conditions.
Maximizing Your Graphic Designer Earnings in Montebello
Compensation in Montebello varies notably based on the specialization and the nature of employment. Senior graphic designers working in brand identity, motion graphics, or packaging design hold positions that typically command higher salaries compared to general graphic design. In-house designers for corporate entities, such as banks or tech companies, tend to receive steadier pay and benefits, but agency roles often provide a broader scope and creative output, albeit with potentially lower initial compensation. Furthermore, independent designers may navigate a commoditized market at the entry level while positioning themselves for premium projects as they accumulate experience. Career advancement often follows a clear path from junior designer to leadership positions like art director or creative director, especially for those possessing advanced credentials and a robust portfolio. As the demand for high-quality design continues to grow, those who align their skills with market needs can expect to see promising returns on their investment in professional development.
More salary data for Montebello, CA:
Frequently Asked Questions
How much do experienced graphic designers make in Montebello in 2026?
What drives higher graphic designer pay in Montebello?
What certifications boost graphic designer salary in Montebello?
Can experienced graphic designers make six figures in Montebello?
How much does graphic designer salary increase over time in Montebello?
Related Pages
Compare Salaries
Career Resources
Nearby Cities in California
Written by Jordan Lee, MFA
Career Analyst
Jordan Lee has 10 years of experience in graphic design. They specialize in branding and visual identity. Their work includes freelance projects for small businesses.
Methodology & Data Source
Top-earner salary figures on this page are 2026 projections derived from the Bureau of Labor Statistics Occupational Employment and Wage Statistics (OEWS) survey, May 2026 release. BLS reported a 90th percentile salary of $103,083 for graphic designers in the Montebello metro area. A 3.36% compound annual growth rate (CAGR), calculated from 6-year national BLS wage trends, was applied to project current 2026 senior-level compensation. Individual earnings depend on certifications, specialization, practice type, and years of clinical experience.
Data Sources & Methodology
Salary data for Montebello is estimated from official BLS state-level occupational wage data (2025), adjusted for regional cost-of-living differences using BEA RPP (Regional Price Parities).
2026 figures are projected from 2025 BLS data using a compound annual growth rate (CAGR) of 3.36%, derived from historical BLS wage trends for graphic designers (SOC 27-1024).
Compiled and verified by Jordan Lee, MFA, a licensed graphic designer with 10+ years of clinical experience. · View source data at BLS.gov